
Deal Teams
Underwriting with the Full Distribution
Deal teams — at allocators, GPs, and family offices alike — get the tools to make data-driven investment decisions. Whether evaluating a private equity opportunity, assessing a private credit deal, or analyzing a real estate investment, the platform provides comprehensive deal-level analysis that goes far beyond traditional financial models.
Outcome Probabilities
P50/P90 Return Thresholds
Value Attribution
Isolate Operational Alpha
Deal Return Scenarios
Your Excel Workflows, Augmented with Quant
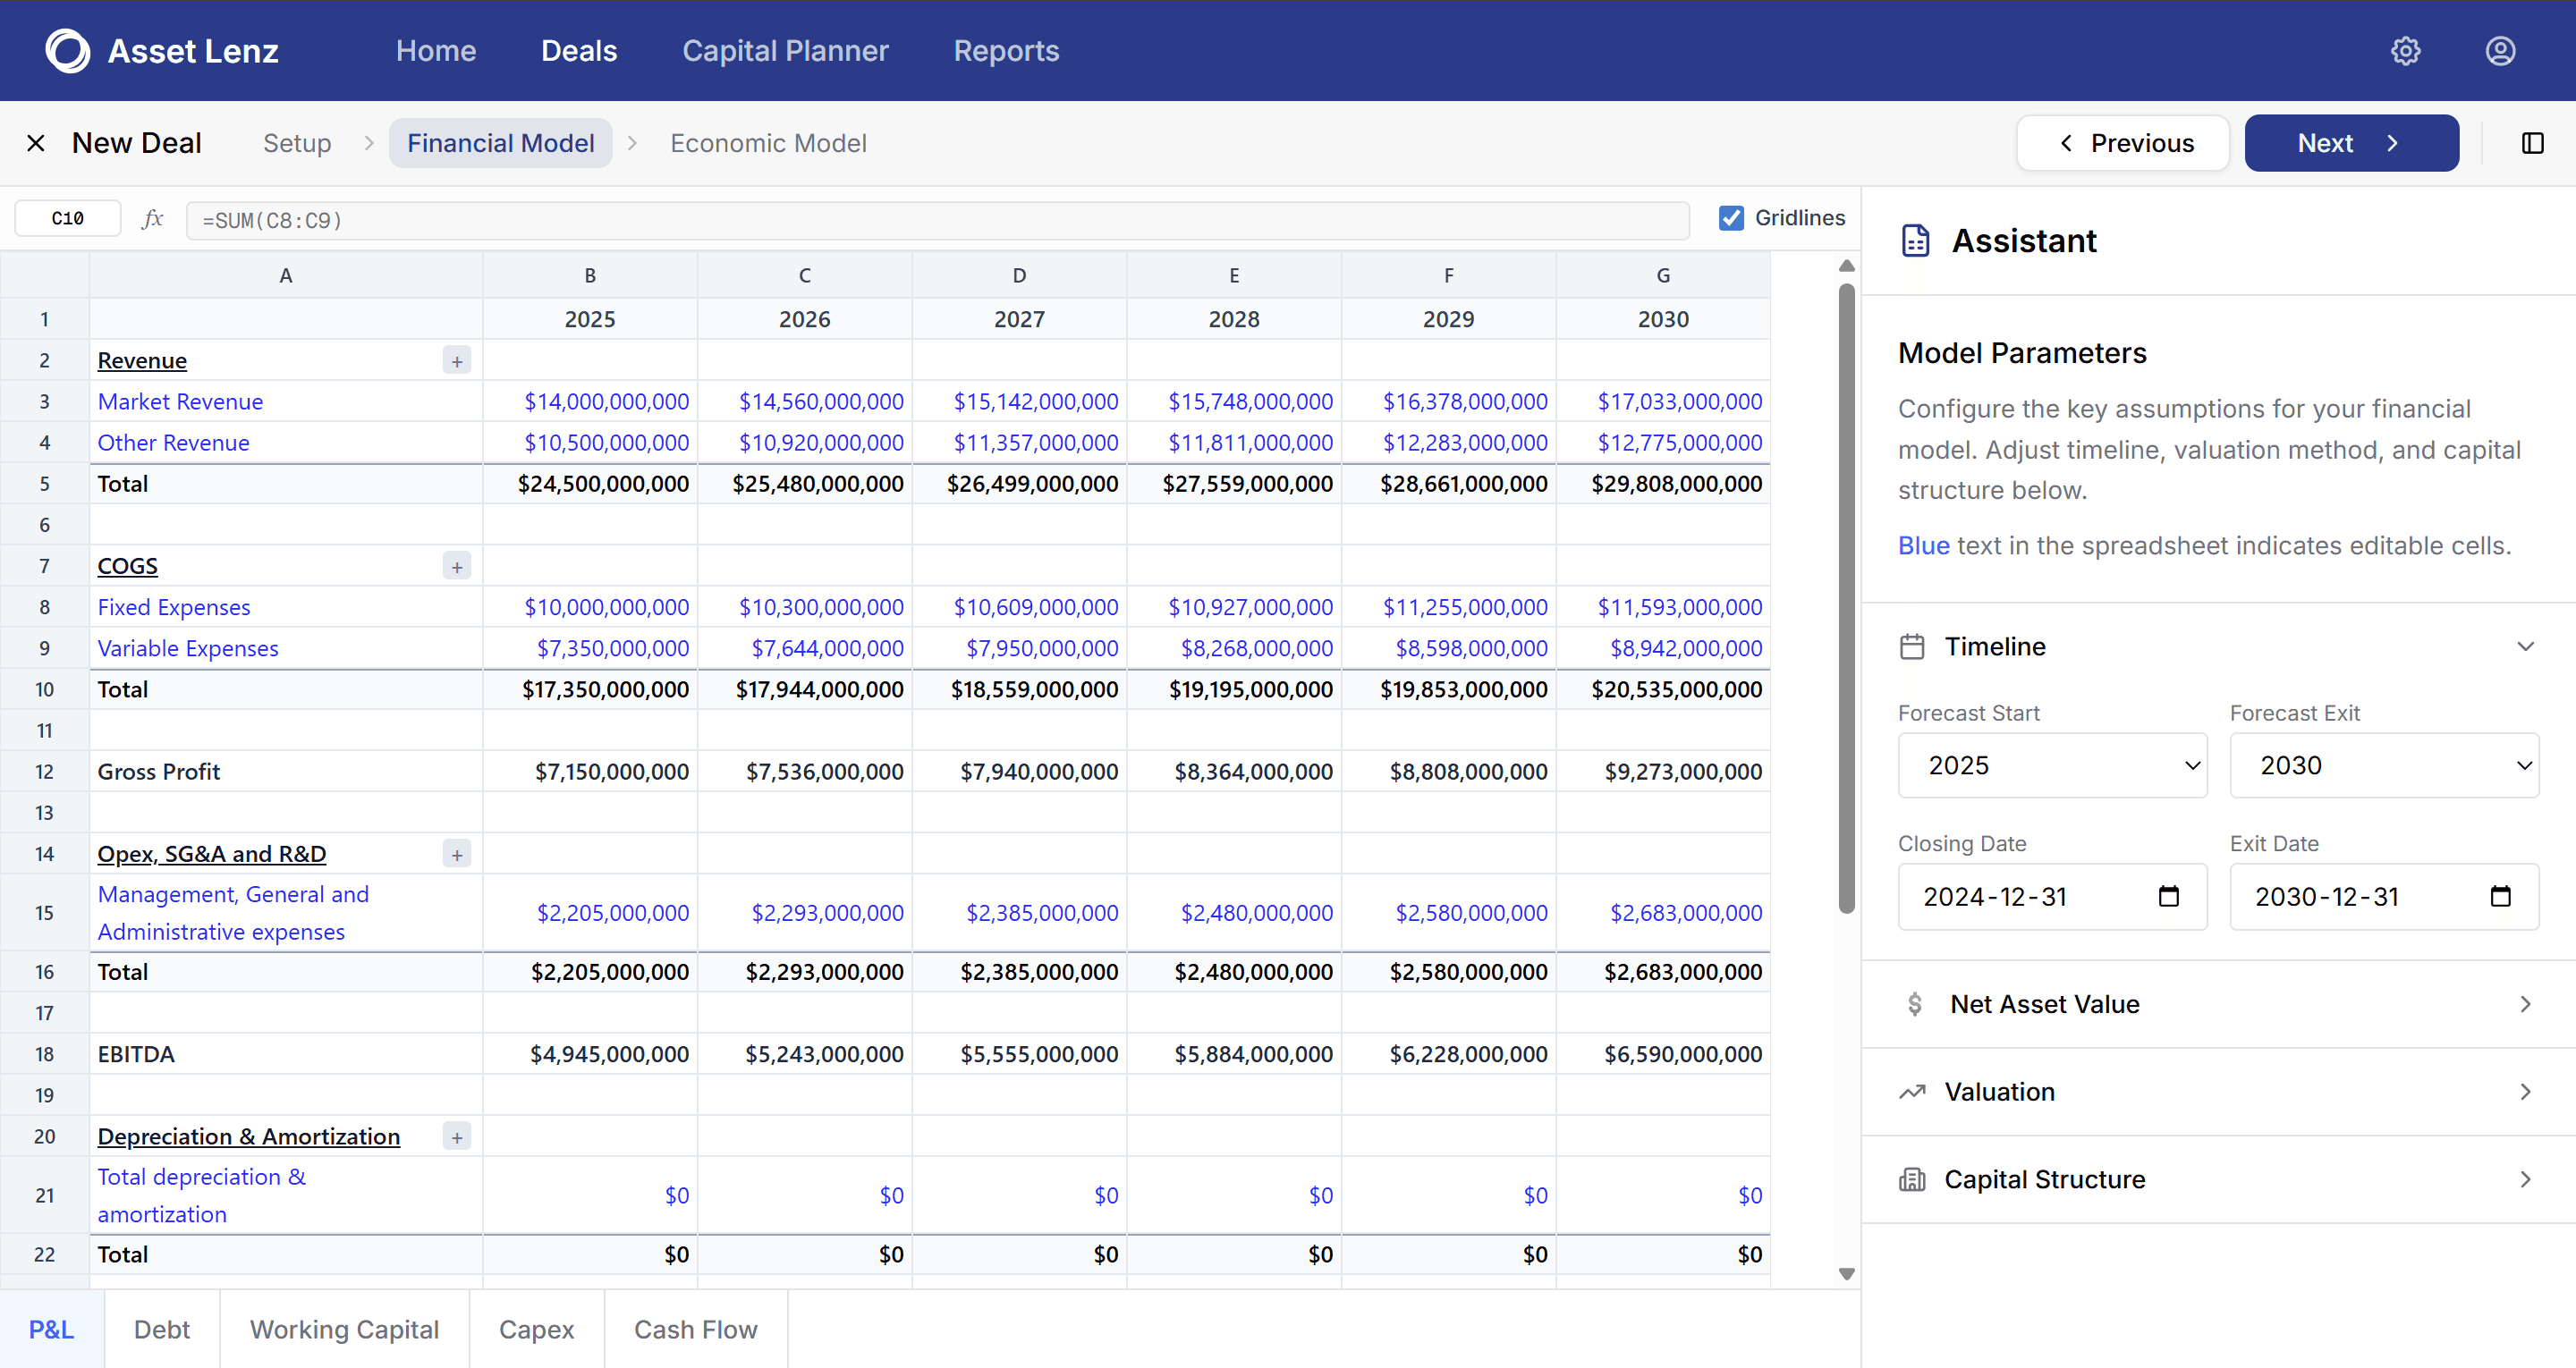
We understand that your existing Excel-based financial models are the foundation of your deal analysis. Rather than replacing them, Asset Lenz enhances your familiar spreadsheet workflows with powerful quantitative capabilities.
Our platform preserves the transparency and flexibility you rely on in Excel—with formulas, editable cells, and familiar financial statement structures—while adding structured model parameters, automated scenario analysis, and quantitative risk assessment — on top of the model your team already trusts.
Maintain your firm's proprietary underwriting templates and calculation logic
Configure key assumptions through structured model parameters instead of scattered cell edits
Extend beyond single-scenario analysis with Monte Carlo simulations and probability distributions
Investor Workflow Lifecycle
Technical Ingest
Parsing of broker packages, messy VDR spreadsheets, and unstructured diligence PDFs.
Extraction agents identify line items for operating expenses, revenue, and capex, then clean and structure fragmented data for deterministic workbook mapping.
Quant Anchoring
Mapping revenue, opex, and debt schedules automatically to your firm's specific underwriting template.
Codify firm-specific cap-rate logic and IRR hurdle rates into a live model. Our engine builds a multi-sheet workbook with linked logic that maintains your firm's proprietary math.
Monte Carlo Risk
Apply macro shocks across thousands of stochastic simulation paths to identify P50/P90 return thresholds.
Visualize the full distribution of outcomes. Quantify tail risk (VaR 1%, VaR 5%) and Expected Shortfall (CVaR) to understand downside exposure across diverse economic regimes.
Memo Generation
Instant generation of data-backed IC memos with return bridges and sensitivity heatmaps.
Generate audit-ready briefings including value creation waterfalls (EBITDA growth, multiple expansion, debt paydown) isolated automatically for internal committee reviews.
Targeted Asset Classes
Each asset-class model is built around the risk drivers that matter for that market — five models, one chassis.
Private Equity Focus
Buyout, growth equity, and control investments. A full return distribution behind the model — for decision making across the capital stack.
Isolate EBITDA growth from Multiple expansion alpha drivers
Monte Carlo risk distribution for IRR and MoC (5th to 95th)
Detailed Value Creation waterfalls per simulation path
Stochastic modelling of Net Debt and Working Capital dynamics
Proprietary exit-multiple sensitivity and path analysis